LetsGrow.com and MJ-Tech first worked together on a shared project in 2023, when we joined forces to conduct research to improve climate management using high-pressure fogging by data-driven decision-making. And so the journey began.
This collaboration comes naturally, as LetsGrow.com is a company that expert in Data-Driven Growing. Helping to grow efficiently and sustainably by making intelligent use of data, and delivering analysis and advice that increases productivity. For over 30 years MJ-Tech has been installing A quality high-pressure fogging (also known as misting) solutions for the international horticultural sector and supporting to ensure best usage and results.
The trial took place in a production company in Canada, where they produce bell-pepper in a 16-ha greenhouse. The company’s owner and grower recognized the benefits and possible impact on their production quality, yield, and operational expenses, which is why they decided to learn the system and understand how to use it as best as possible; when is the right time to fog, what impact will fogging have on the crop, should other aspects be adapted (e.g., ventilation, screening, etc.) when applying fogging, and more. To answer these questions, we conducted a trial. This whitepaper will introduce the first part of this collaboration, discussing the trial’s background, methods used, results, and future plans.
Table of Content
-
The Biology Behind the Trial & Key Terms
-
Difference between Vapor Pressure Difference and Vapor Pressure Deficit
-
Trial
-
High-Pressure Fogging
-
Results
-
Conclusion
-
What next?
-
References
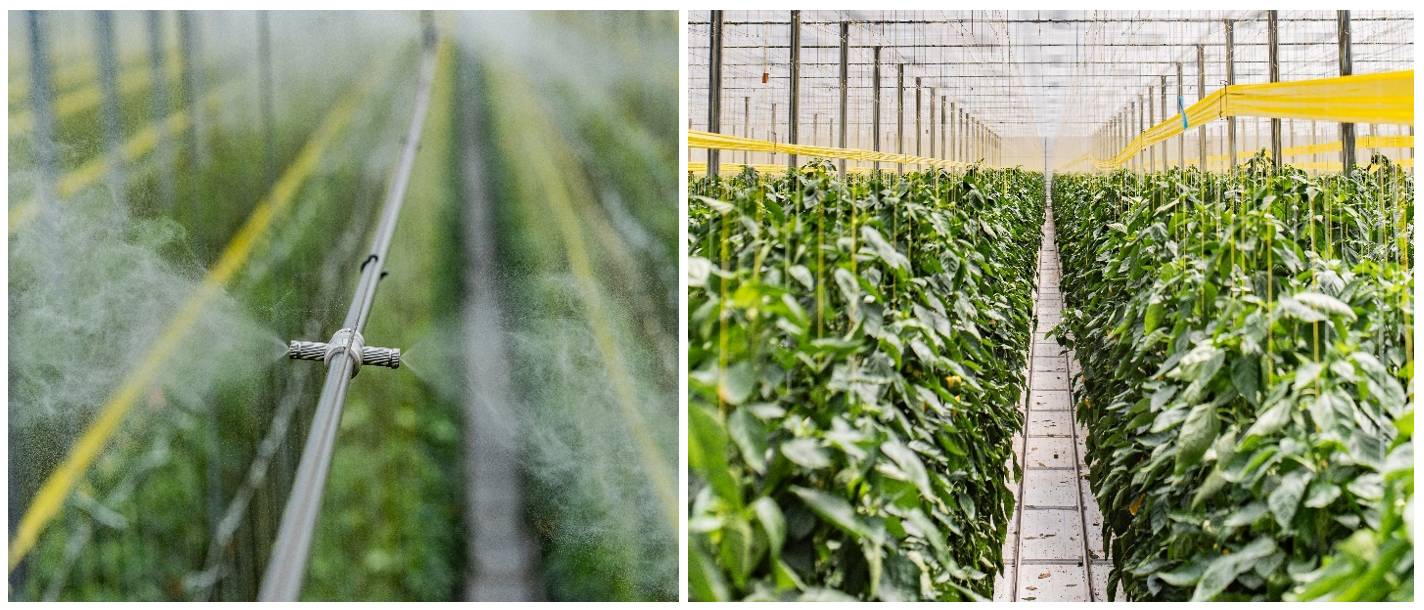
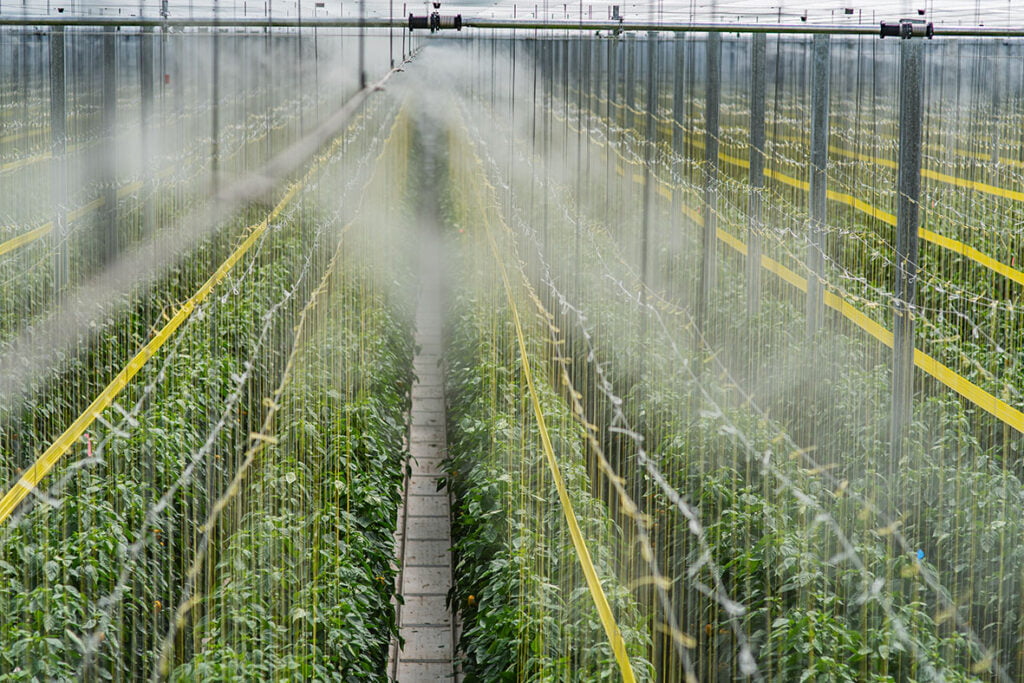
Figure A. bell pepper greenhouse in Canada, where the trial took place
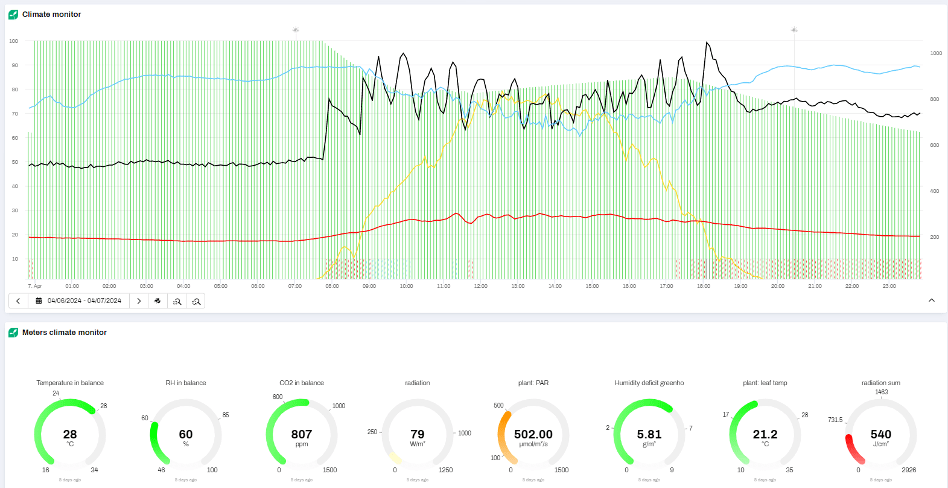
Figure B. Climate monitor example as shown at LetsGrow.com. Green vertical bars show the percentage of climate in balance. Climate parameters are shown with different color lines, radiation (W/m2) (yellow), temperature greenhouse (°C) (red), relative humidity of the greenhouse (%) (blue), and CO2 (ppm) (black).
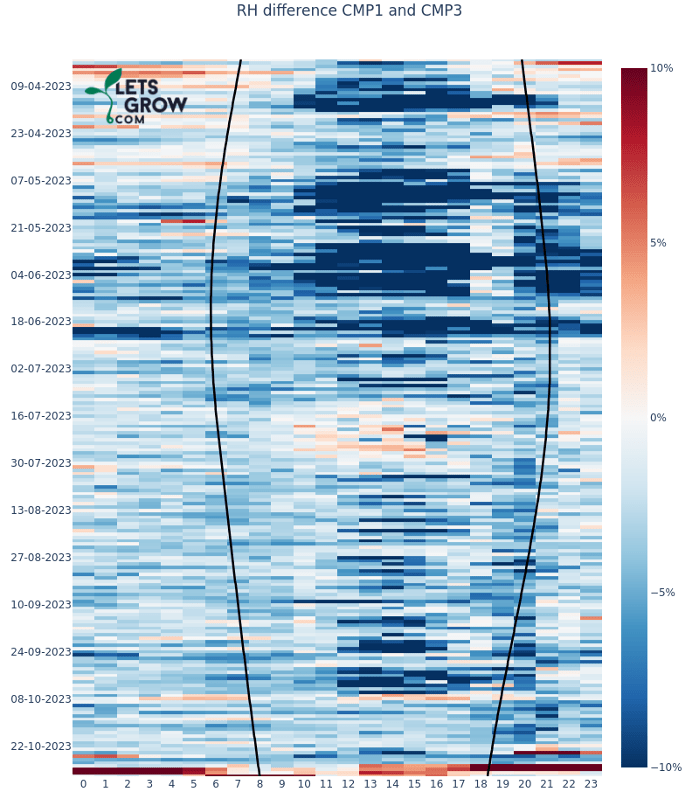
Figure G. Relative humidity difference between compartments 1 (no misting) and 3 (misting) during April and October 2023. Dark blue colors indicate that compartment 3 had a higher humidity by 2-10% compared to compartment 1. The graph was produced using the strategy scan tool by LetsGrow.com.
Would you like to review the complete whitepaper? Please fill in the form below and we will send you by email the file.
Come by our booth at GreenTech Amsterdam, on June 11, 12, and 13th to discuss the whitepaper and any other topics or questions you might have. MJ-Tech’s booth number is 05.320, our experts will be there, looking forward to welcoming you!

